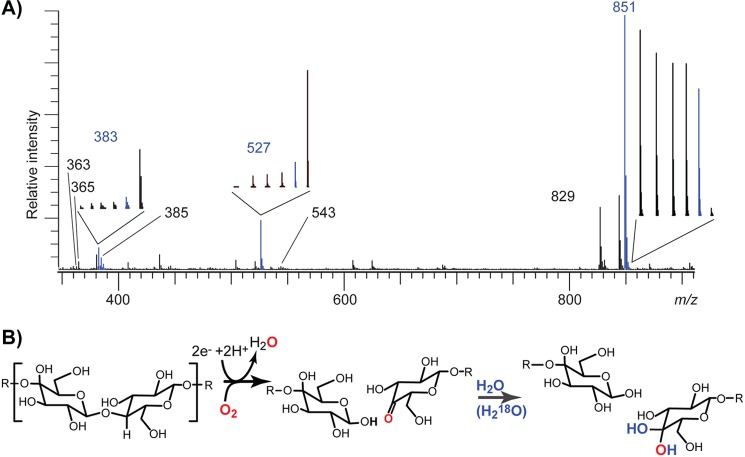
FIGURE 3.
A, ESI-MS analysis of products generated over time during degradation of Glc5 (m/z 851) in H218O. Reaction products were analyzed after 0, 5, 15, 25, 90, and 1440 min of incubation, and the main picture shows the full spectrum for the 90-min sample. The insets show the signal over time for key products (from 0 to 1440 min, from left to right; the blue signal represents the 90-min sample). The m/z values 851, 527, and 365 correspond to the sodium adducts of Glc5, Glc3, and Glc2, respectively (m/z 829 is [M+H]+ for Glc5), whereas m/z 383 and the minor m/z 543 correspond to [M+Na]+ of gemdiol products (Glc4GemGlc and Glc4GemGlc2) carrying one 18O (see Fig. 1; the mass difference between sodium and lithium is 16 Da). The 383 signal is accompanied by a signal at m/z 385 because of exchange with the solvent, which gradually leads to incorporation of two 18O atoms. The mass of 363 corresponds to the keto-form of the oxidized dimer ([M+Na]+), and its intensity corresponds to ∼10% of the intensity of the gemdiol. B, schematic presentation of enzymatic cleavage of the glycosidic bond and introduction of molecular oxygen in the nonreducing end, followed by water incorporation transforming the keto group into a gemdiol. The incorporation of water leads to uptake of 18O in the products.

