
FIGURE 6.
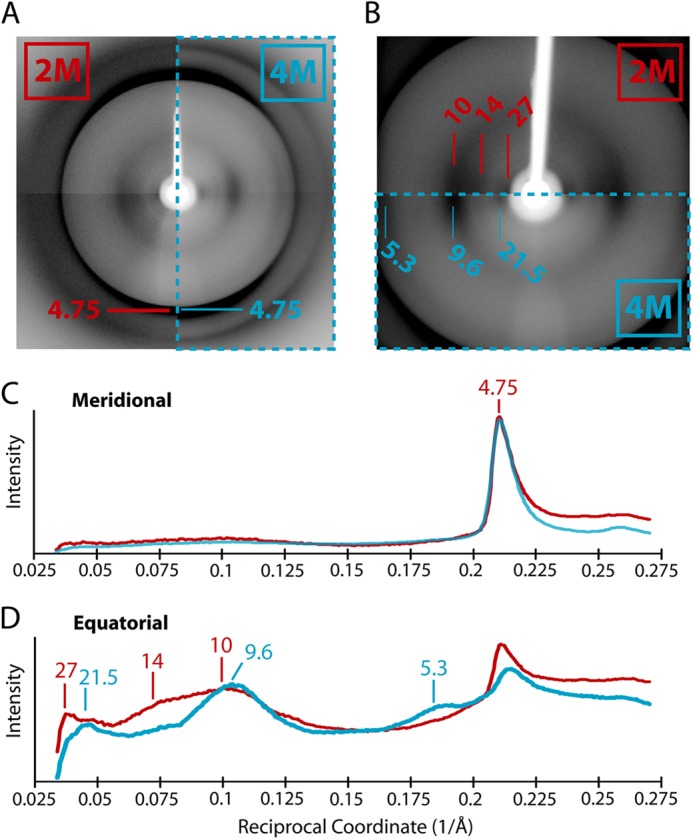
X-ray fiber diffraction of fibrils formed in 2 and 4 m GdmCl. A, the x-ray diffraction patterns of rPrP-A2M (left) and rPrP-A4M (right, enclosed in dashed box) fibrils are compared. Both fibril types have a prominent 4.75-Å meridional reflection corresponding to the spacing between β-strands along this axis. B, diffraction images of lower resolution reflections point to the differences along the equator between rPrP-A2M (upper) and rPrP-A4M (lower, enclosed in a dashed box) fibril diffraction patterns. C, a comparison of the intensity profiles of reflections along the meridian for rPrP-A2M (red line) and rPrP-A4M (blue line) fibrils shows that both have a similar 4.75-Å reflection. D, a comparison of the intensity profiles along the equator shows that rPrP-A2M and rPrP-A4 M fibrils have different peak reflections, indicating packing differences within the amyloid core. In C and D, peaks are labeled in units of Å.