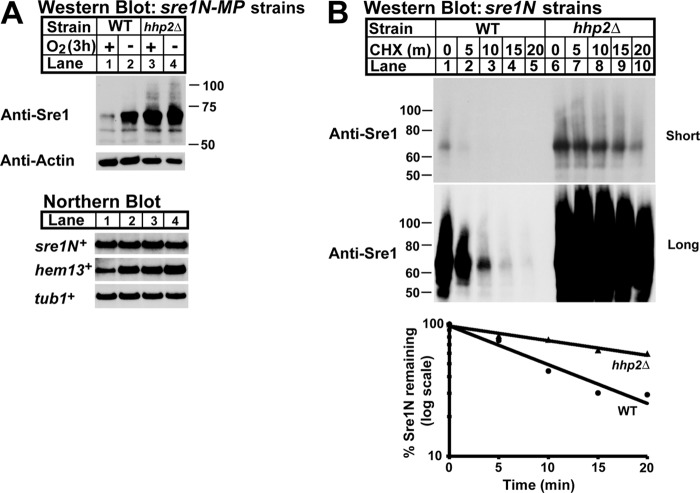
FIGURE 4.
Hhp2 accelerates Sre1N degradation. A, Western (top panel) and Northern (bottom panel) blot analyses of sre1N-MP and sre1N-MP hhp2Δ strains grown in the presence or absence of oxygen for 3 h. Whole-cell lysates and total RNA were analyzed as in Fig. 3. Blots shown are representative of three independent experiments. B, cycloheximide chase experiment of sre1N and sre1N hhp2Δ cells grown in the absence of oxygen for 4 h, treated with cycloheximide (CHX) (200 μg/ml) at t = 0, and shifted to normoxic conditions for the indicated time. Graph shows percentage of Sre1N remaining at each time point. Blot and graph are representative of three independent experiments.

