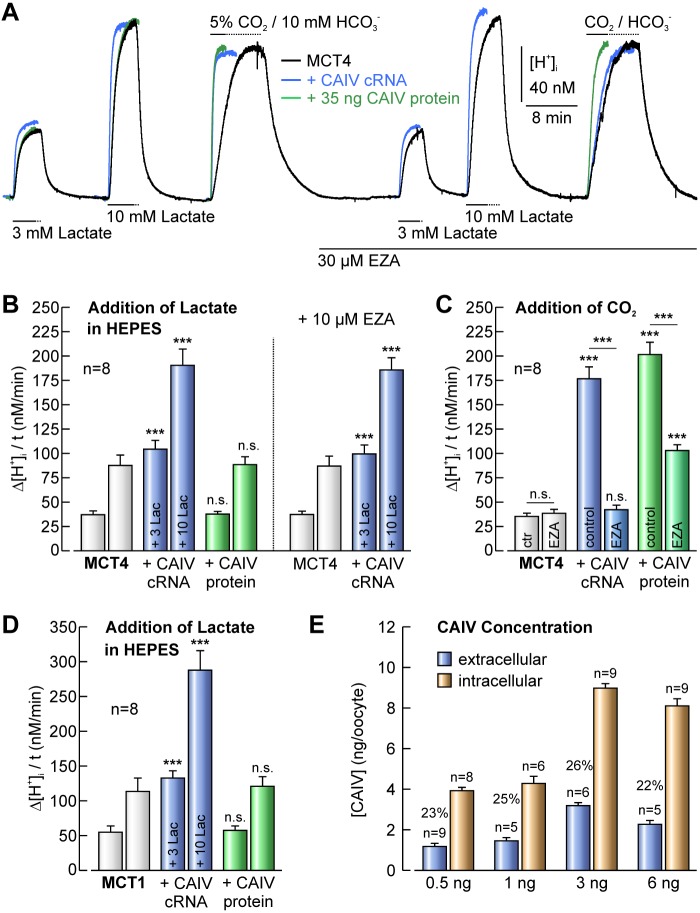
FIGURE 3.
Transport activity of MCT1 and MCT4 is enhanced by coexpression of CAIV, but not by injection of CAIV protein. A, original recordings of [H+]i in Xenopus oocytes either expressing MCT4 (black trace) or co-expressing MCT4+CAIV (blue trace) and MCT4-expressing oocytes, additionally injected with 35 ng of mature CAIV protein (green trace) during application of 3 and 10 mm lactate and 5% CO2/10 mm HCO3− in the absence and presence of 30 μm EZA. B, rate of change in [H+]i induced by application of lactate in oocytes expressing MCT4 or co-expressing MCT4+CAIV and MCT4-expressing oocytes, additionally injected with CAIV protein in the absence and presence of EZA. C, rate of change in [H+]i induced by application of 5% CO2/10 mm HCO3− in oocytes expressing MCT4 or co-expressing MCT4+CAIV and MCT4-expressing oocytes, additionally injected with CAIV protein in the absence and presence of EZA. D, rate of change in [H+]i induced by application of lactate in oocytes expressing MCT1 or co-expressing MCT1+CAIV and MCT1-expressing oocytes, additionally injected with CAIV. Asterisks at the bars for MCT1+CAIV-coexpressing oocytes refer to the values of MCT1-expressing cells. E, amount of extracellular (blue bars) and intracellular (orange bars) localized CAIV in oocytes injected with 0.5, 1, 3, and 6 ng of CAIV-coding cRNA, as determined by mass-spectrometric analysis. The percent values indicate the relative amount of extracellular CAIV.

