FIGURE 2.
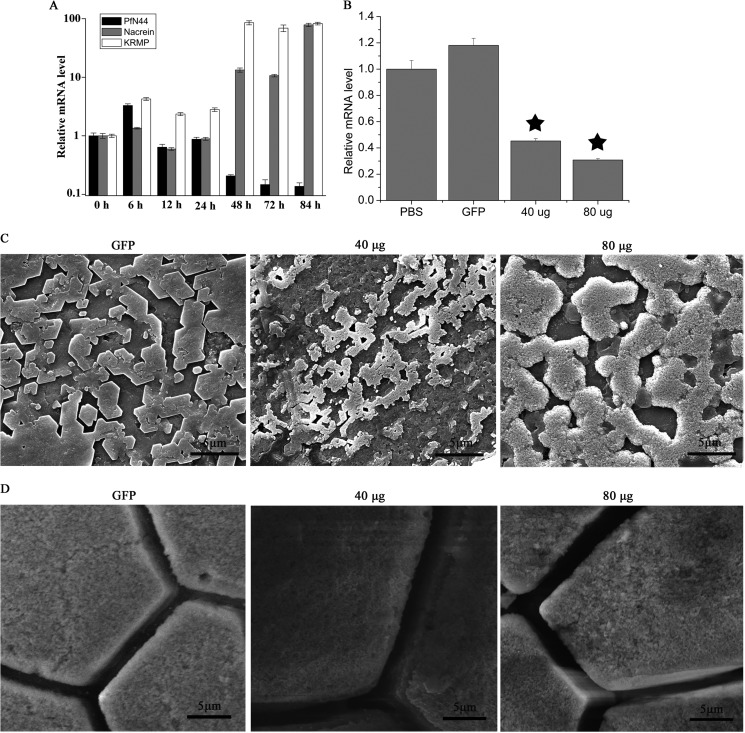
In vivo functions of PfN44. A, PfN44 expression in shell notching. Expression of the unnotched groups (0 h) gave a relative value of 1.0. The y axis showed a log standard. B, PfN44 expression inhibited by RNAi. Control, PBS-injected groups gave a relative value of 1.0. The non-target control was GFP dsRNA. Star, significant (p < 0.001) difference compared with PBS-injected groups. C, SEM nacreous layer of inner surface. GFP dsRNA-injected group showed normal stair-like growth; 40 and 80 μg of PfN44 dsRNA-injected groups showed overgrowth. Scale bars, 5 μm. D, SEM prismatic layer of inner surface. Scale bars, 5 μm.

