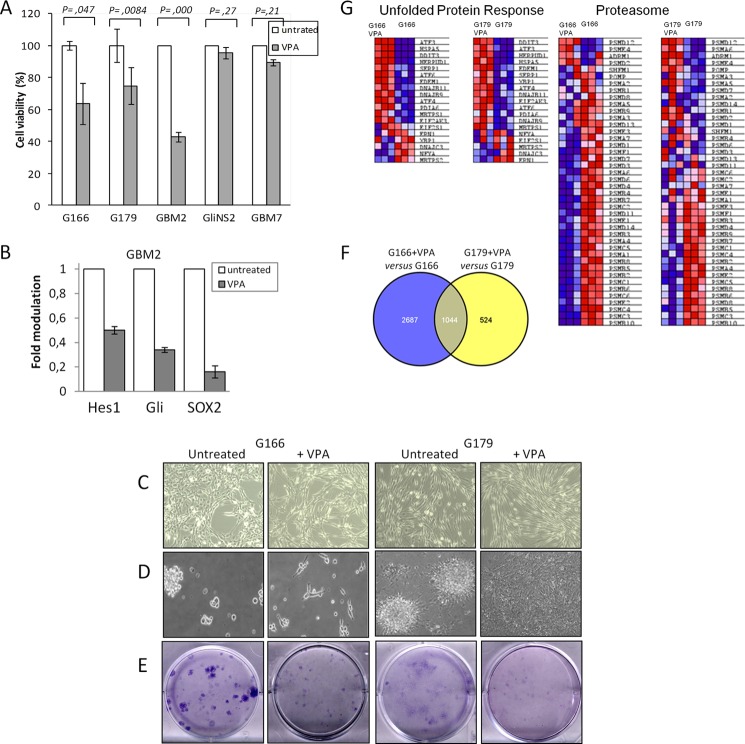
FIGURE 4.
VPA affects phenotypic and molecular characteristics of GSC lines. A, an MTT assay was applied to evaluate the viability of GSC lines after VPA treatment. The histogram shows cell viability values expressed as -fold modulation relative to untreated samples. p was used to determine statistical significance. B, pPCR of GBM2 VPA-treated. GBM2 were exposed to VPA treatment and analyzed for genes expression using qPCR. The histogram shows expression values of VPA-treated cells normalized relative to the housekeeping gene and are expressed as -fold modulation relative to untreated cell line. C and D, representative images of GSC lines plated on laminin-coated flasks (C) or maintained in neurosphere conditions (D) in the absence or presence of VPA. E, GSC lines (800 cells/well-6) were exposed to VPA and assayed for colony formation. The drug was replaced with fresh growth medium, and cells were allowed to form colonies for a further 12 days. Colonies were stained with Giemsa. The images are representative of three independent treatments. F, a Venn diagram shows the number of overlapping genes differentially expressed in VPA-treated GSC lines. G, UPR and a proteasome heat map in VPA-treated and untreated GSC lines.

