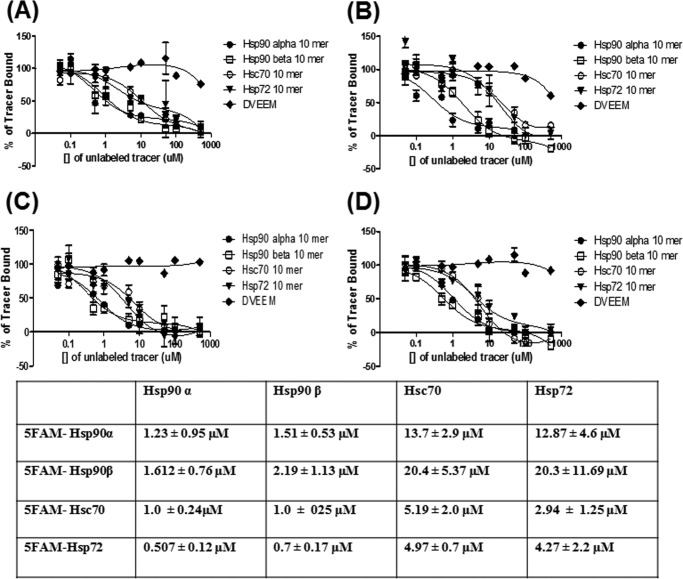
FIGURE 3.
Competition studies confirm binding data. A, competition of 5FAM-HSP90α (20 nm) with increasing concentrations of unlabeled tracer (HSP90α, HSP90β, HSC70, and HSP72 peptides). B, competition of 5FAM-HSP90β (20 nm) with increasing concentrations of unlabeled tracer (HSP90α, HSP90β, HSC70, and HSP72 peptides). C, competition of 5FAM-HSC70 (20 nm) with increasing concentrations of unlabeled tracer (HSP90α, HSP90β, HSC70, and HSP72 peptides). D, competition of 5FAM-HSP72 (20 nm) with increasing concentrations of unlabeled tracer (HSP90α, HSP90β, HSC70, and HSP72 peptides). Data are presented as mean ± S.D. (n = 3).

