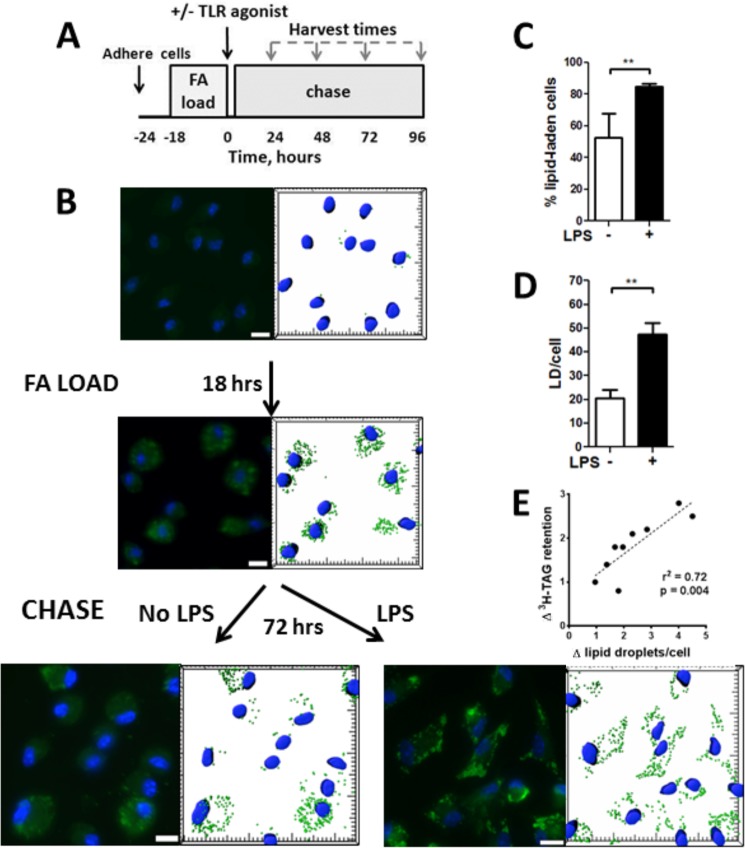
FIGURE 1.
LPS stimulates lipid body retention in macrophages. A, flow diagram for the experiments. B, cells showing Nile Red fluorescence (green) and stained nuclei (DAPI, blue) are shown to the left of an image of the same field that shows lipid droplets as analyzed using Imaris software. C, percentage of the cells that were lipid-laden (>15 lipid droplets/cell) after chase for 72 h. D, average number of lipid droplets per cell. Data are from four independent experiments. E, fold-change (Δ) in lipid droplets/cell (+LPS/no LPS) positively correlated with the fold-change (Δ) in [3H]TAG retention. **, p < 0.01.

