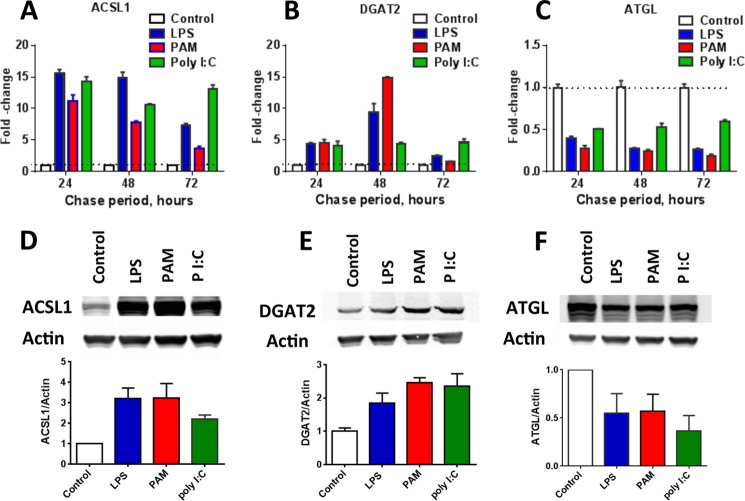
FIGURE 5.
TLR agonists alter mRNA transcript and protein abundance. A–C, time course of mRNA transcript abundance, determined using Q-PCR, in FA-loaded cells that were stimulated with LPS (5 ng/ml), PAM (1 μg/ml), or poly(I:C) (15 μg/ml). Bars show mean + 1 S.E. for determinations from three independent experiments, each with n = 2 or 3. Agonist-induced changes persisted for 72 h. D–F, Western blots performed after 72 h chase showing LPS-induced increases in ACSL1 (D) and DGAT2 (E) and decreases in ATGL (F). Protein quantitation is shown below each Western blot. Bars show mean +1 S.D. from three or more analyses. In each panel, the changes shown for each agonist were different from control (FA only, no agonist) at each time point (A–C) and in each Western quantitation (D–F) (p ≤ 0.05).

