
FIGURE 7.
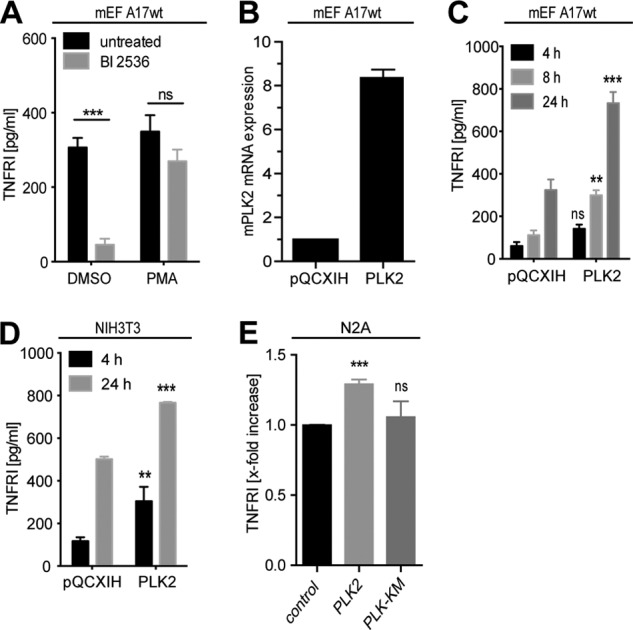
Activity analysis of ADAM17. A, activity of ADAM17 was studied through the analysis of ADAM17-specific shedding events. wt mEFs expressing the endogenous ADAM17 substrate TNFRI were seeded at a density of 500,000 cells. After 24 h, cell culture medium was replaced by medium containing either 1 μm of the pan-PLK inhibitor BI 2536 (gray bars) or DMSO (vehicle control, black bars). Media were conditioned for 6 h, and afterward 100 nm PMA was added for 1 h. B, wt mEFs were stably transfected with wt PLK2 or mock plasmid (pQXCIP). Quantitative RT-PCR analysis was performed to quantify PLK2 expression levels in the stable transfected mEF cells. One representative experiment is shown. C, stably transfected wt PLK2-mEF cells as well as mock transfected cells (pQXCIP-mEFs) were seeded at a density of 250,000 cells/12 wells. 24 h later the cell culture medium was replaced and conditioned for the indicated time periods. D, stably transfected wt PLK2-NIH3T3 cells as well as mock transfected cells (pQXCIP-NIH3T3) were seeded at a density of 500,000 cells. 24 h later, the cell culture medium was replaced and conditioned for the indicated time periods. E, Neuro2A cells were transiently transfected with PLK2 or PLK2KM and seeded at a density of 1 × 10⁶ cells. 24 h later, the cell culture medium was replaced and conditioned for 24 h (n = 3). All error bars denote S.E. **, p < 0.01; ***, p < 0.001; ns, not significant. For the ELISA experiment, we show the mean of three independent experiments performed in duplicate.