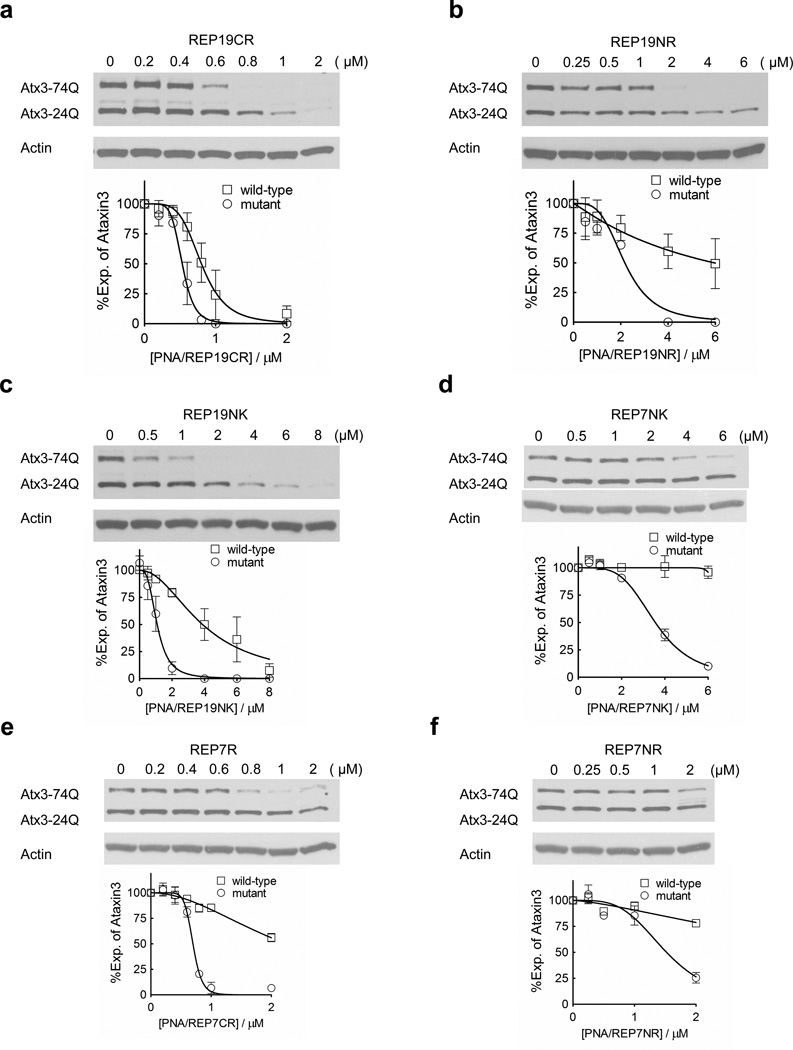
Figure 3. Effects of peptide orientation and chemistry on ATX3 expression.
19-base PNAs (a–c) or 7-base PNAs (d–f) with 8 lysines or arginines at their N or C-terminus were tested in patient fibroblast cell line GM06151 (CAG 74 mutant repeats/24 wild-type repeats) at increasing concentrations. Representative western blot images are presented. Quantification and a nonlinear fitting curve of ATX3 expression is plotted from multiple experiments. Error bars are SEM.

