
Figure 2.
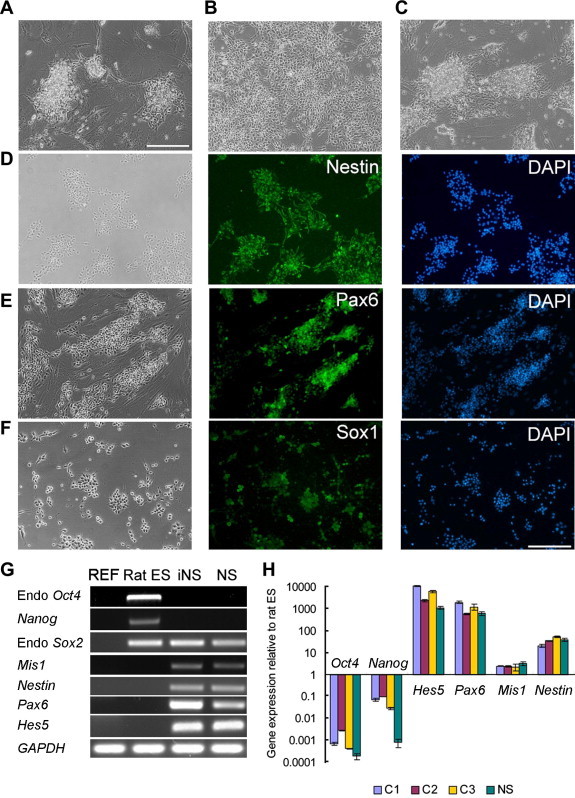
iNS cells derived from rat fibroblasts A. Morphology of rat iNS cell colonies 21 days after transfection of Oct4, Sox2, Klf4 and c-Myc into rat embryonic fibroblasts. Scale bar, 50 μm. B. Rat iNS cells cultured on feeders in the presence of LIF/CHIR/Y at Passage 21. C. Rat iNS cells cultured on 0.1% gelatin in the presence of LIF/CHIR/Y at Passage 15. D–F. Immunostaining of rat iNS cells maintained in the presence of LIF/CHIR/Y. Scale bar, 50 μm. G. RT-PCR analysis of gene expression in rat embryonic fibroblasts (REF), rat ES cells, rat iNS cells and primary rat NS cells derived from E11.5 rat fetal brain and maintained in the presence of LIF/CHIR/Y. GAPDH was used as a loading control. H. qRT-PCR analysis of gene expression. C1, C2 and C3 were three rat iNS cell clones. NS: primary NS cells derived from E11.5 rat fetal brain. Data are presented as mean ± standard deviation (SD) of three biological replicates.