
Figure S4.
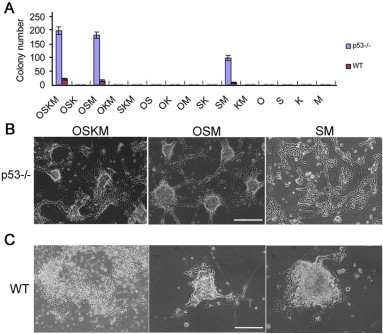
Generation of rat iNS cells by different combination of transcription factors (A) Quantification of iNS colonies derived from p53−/− and wild type (WT) REFs infected with different combinations of the four transcription factors Oct4 (O), Sox2 (S), Klf4 (K) and c-Myc (M). REFs were plated at 1 × 10⁵ cells per 35-mm dish. iNS cell-liked colonies were scored under a microscope. Data are presented as mean±SD of three biological replicates (colony number per 1 × 10⁵ REFs plated). (B and C) Representative images of iNS colonies generated from different transcription factor combinations. Scale bars, 50 μm.