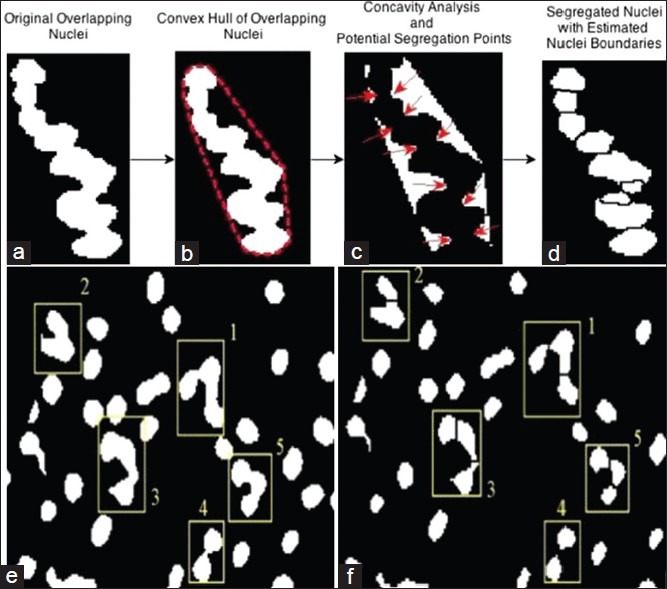
Figure 5.

Schema for concavity analysis for geometric overlapping nuclei segregation (a-d) and composite geometric (concavity-analysis) and intensity (marker-controlled watershed) based nuclei segregation shown on randomly selected nuclei clusters (e and f)
