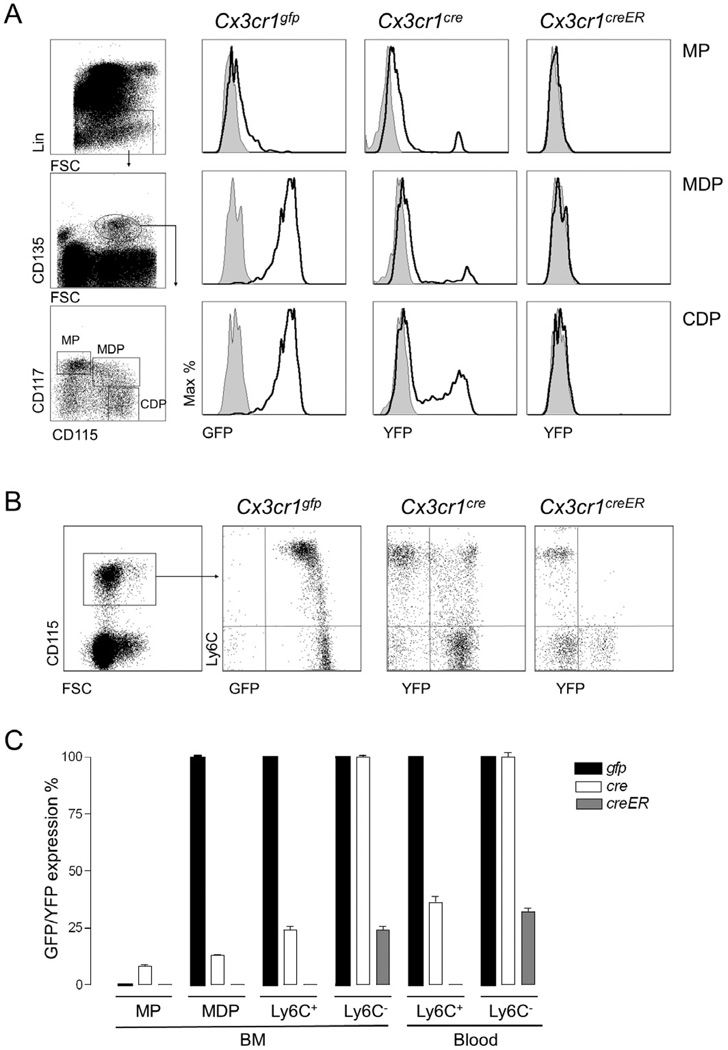
Figure 3. Reporter gene expression profile of mononuclear phagocyte precursors and circulating monocytes.
(A & B) Flow cytometric analysis of different mononuclear phagocyte populations, precursors (A) and blood monocytes (B) obtained from Cx3cr1gfp/+, Cx3cr1cre/+:R26-yfp and Cx3cr1creER/+:R26-yfp mice. Cx3cr1creER/+:R26-yfp mice were treated for 4 weeks with Tamoxifen prior to analysis. Results are representative of 4–6 mice per group.
(C) Bar graph summarizing frequencies of GFP or YFP+ cells in indicated mononuclear phagocyte populations of Cx3cr1gfp/+, Cx3cr1cre/+:R26-yfp and Cx3cr1creER/+:R26-yfp mice. Mean ± SEM are performed with n=4–6 mice per group.

