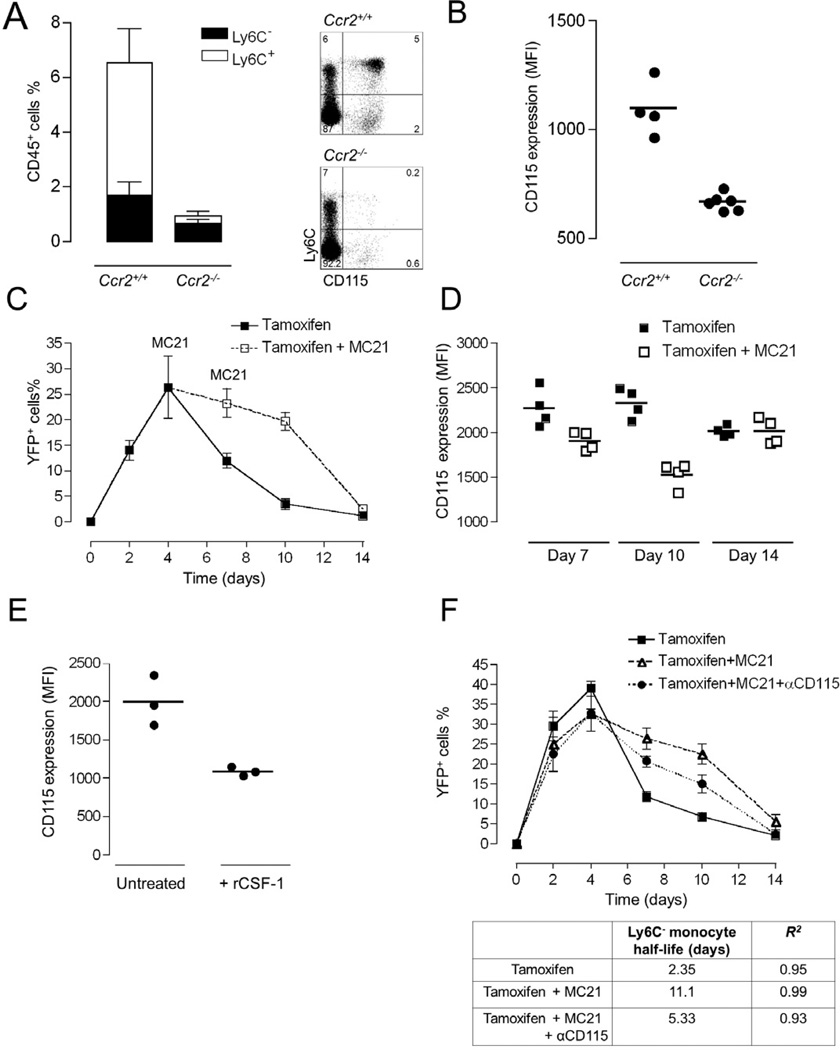
Figure 6. Prevalence of Ly6C+ blood monocytes determines the circulation half-life of Ly6C− blood cells.
(A) Analysis of Ly6C+ and Ly6C− blood monocyte subsets of Ccr2+/+ Cx3cr1gfp/+ and Ccr2−/− Cx3cr1gfp/+ mice. Mean ± SEM are performed with n=4–6 mice per group.
(B) Mean fluorescent intensities of CD115 expression on Ly6C− monocytes analyzed in (A). Mean ± SEM are performed with n=4–6 mice each.
(C) Flow cytometric analysis of blood of Cx3cr1creER/+:R26-yfp mice treated by tamoxifen gavage to induce excision of the STOP cassette from R26-YFP loci. Ly6C− blood monocytes were analysed over a 2 week period for reporter gene expression. Mice were left untreated or treated with the CCR2 antibody MC21. Representative result of two experiments involving 3 mice per group.
(D) Mean fluorescent intensities of CD115 expression on Ly6C− YFP+ monocytes analyzed in (D). Mean ± SEM are performed with n=3 mice per group.
(E) Mean fluorescent intensities of CD115 expression on Ly6C− monocytes of mice that received an injection of recombinant CSF-1. Mean ± SEM are performed with n=3 mice each.
(F) Flow cytometric analysis of blood of tamoxifen treated Cx3cr1creER/+:R26-yfp mice. Ly6C− blood monocytes were analysed over a 2 week period for reporter gene expression. Mice were left untreated, treated with the anti-CCR2 antibody, or treated with a combination of MC21 and anti-CSF-1 R. Table summarizes half-lives of Ly6C− blood monocytes in the time window from 4 to 10 days, as determined by exponential trendline fitting.

