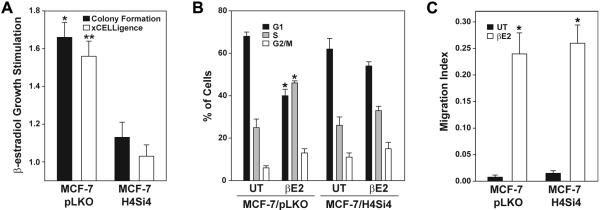
Fig. 2.

HER4 expression is required for estrogen-stimulated proliferation of breast tumor cells. (A) For colony formation assay MCF-7/pLKO and MCF-7/H4Si4 cells were plated at 1,000 cells per well in a 6-well plate with phenol red–free MEM supplemented with 5% CS-FBS with or without 10 nM 17-β-estradiol. Media was changed every two days and after 12 days the number of fixed and stained colonies was calculated using a ColCount Colony Counter. For the xCELLigence cell growth assay 2000 cells were plated in an E-Plate 16 in the RTCA DP Instrument. After 24 hrs media was changed to phenol red–free MEM supplemented with 5% CS-FBS and after an additional 48 hrs cells were left untreated or treated with 10 nM 17-β-estradiol. The slope of the change in cell index during a 72 hrs treatment was used to determine relative growth stimulation. Data represents 17-β-estradiol stimulated growth relative to untreated cells. (B) Cell cycle analysis of each cell line preincubated in phenol red–free MEM supplemented with 5% CS-FBS for 48 hrs followed by serum-free phenol red-free MEM for 24 hrs. Cells were returned to phenol red–free MEM and 5% CS-FBS with (βE2) or without (UT) 10 nM 17-β-estradiol for 24 hrs and cell cycle analysis was performed on fixed and stained cells in a Guava Easy Cyte Mini Base System. (C) Cell migration assay of each cell line preincubated in phenol red–free MEM supplemented with 5% CS-FBS for 48 hrs and then transferred to the upper CIM-Plate 16 chamber. The upper and lower chambers contained phenol red–free MEM supplemented with 0.2% and 5% CS-FBS, respectively, with or without 10 nM 17-β-estradiol. Using the xCELLigence System cell Index (referred to here as Migration Index) and standard deviation of replicates were calculated after 48 hrs using the RTCA Software. For all experiments samples were prepared in triplicate and the data represents the mean +/− SE of at least three independent experiments. Statistically significant differences between data sets were determined using paired Student's t test. Asterisk and double asterisks in (A) represent p = 0.013 and p = 0.008, respectively. Asterisk in (B) and (C) represent p = 0.001 and p < 0.005, respectively.
