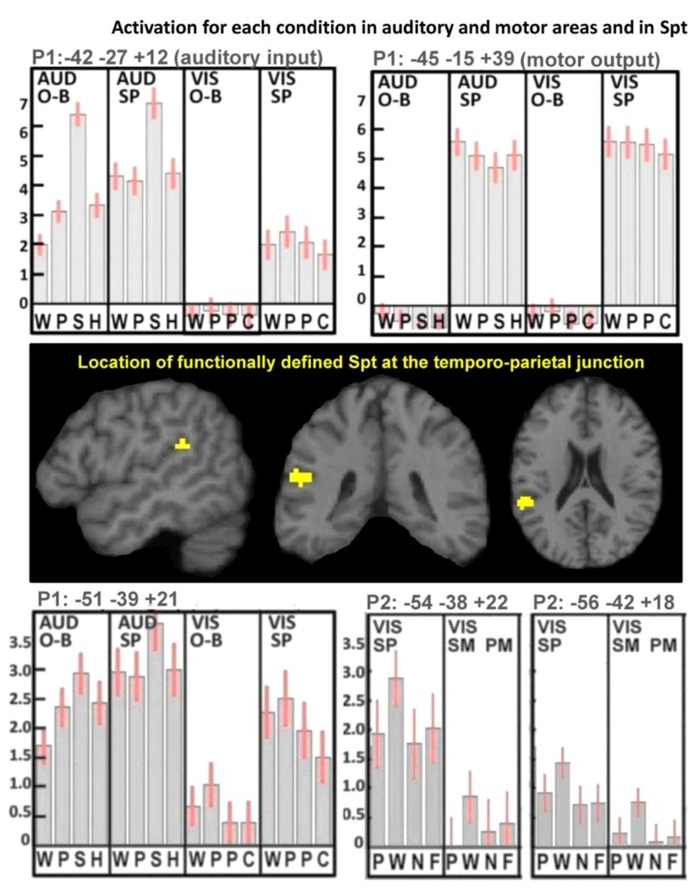
FIGURE 3.
Activation for each condition in auditory and motor areas, and in Spt. These results illustrate the mean activation responses across all conditions in primary auditory and motor areas as well as in Spt. The top plots show activation responses for one-back (O-B) and speech production (SP) tasks in both auditory (AUD) and visual (VIS) modalities in left Heschl’s gyrus (top-left plot, labeled “auditory input”) and left central sulcus (top-right plot, labeled “motor output”). In the AUD modality, the stimuli were words, pseudowords, environmental sounds, and humming (WPSH). In the VIS modality, the stimuli were words, pseudowords, pictures of objects, and pictures of scrambled objects (WPPC). The center images locate our functionally defined mask for Spt at the TPJ. The bottom plots show activation responses in Spt in Paradigm 1 (P1; bottom-left plot) and in Paradigm 2 (P2; bottom-right plot). As both top plots use P1, the conditions are the same in the bottom-left plot. The bottom-right plot shows the primary and secondary peaks for Spt in P2, where the tasks were spoken response (SP), semantic matching (SM), and perceptual matching (PM) all in the visual (VIS) modality. Stimuli comprised pictures, words, nonobjects, and false-fonts (PWNF). In all five plots, error bars represent 90% confidence intervals. See Section “Materials and Methods.” Note that in P1, activation in both Heschl’s gyrus and Spt is lowest for the visual one-back task (O-B) because there was no auditory input in either the stimulus or the response. During the visual speech production conditions (VIS-SP) activation was observed in auditory areas because participants can hear the sound of their spoken response.

