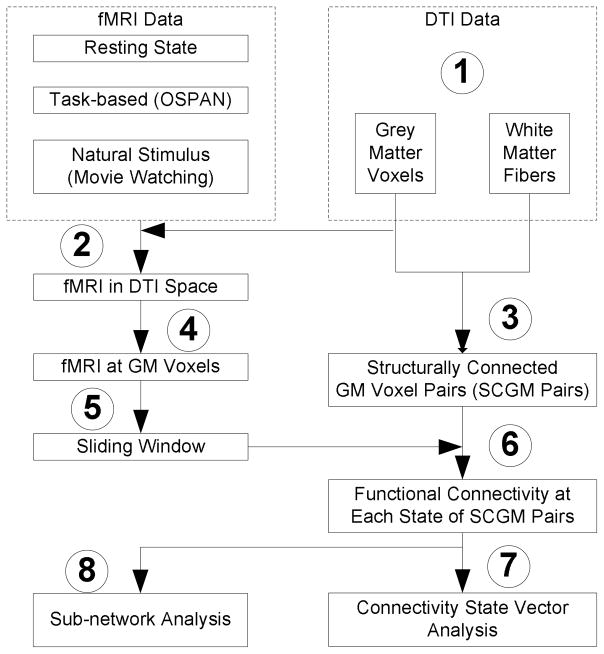
Figure 1.
The flowchart of the algorithmic pipeline for fiber-centered brain state change detection. Eight steps are labeled as follows. (1) brain tissue segmentation (gray matter (GM) and white matter (WM)) and fiber tractography using DTI data; (2) warping fMRI images to the DTI space via image registration; (3) identification of structurally-connected GM (SCGM) voxel pairs; (4) fMRI signal extraction at each SCGM voxel pair; (5) applying sliding windows to fMRI signals; (6) functional connectivity analysis for each SCGM voxel pair within the sliding window; (7) functional connectivity vector (FCV) construction for each sliding window; (8) Sub-network analysis of fiber-centered functional connectivity dynamics.

