
Figure 12.
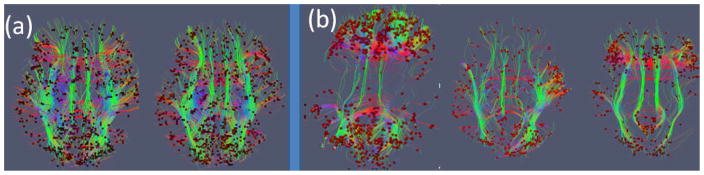
Visualization of fibers with functional connectivity value (defined as the averaged FC of all voxel pairs connected by the fiber greater than a predefined threshold from a randomly selected subject. (a) Functional connectivity during resting state in two different time windows; (b) Functional connectivity during natural stimulus states (when watching CNN video news) within three different time windows.