
Figure 13.
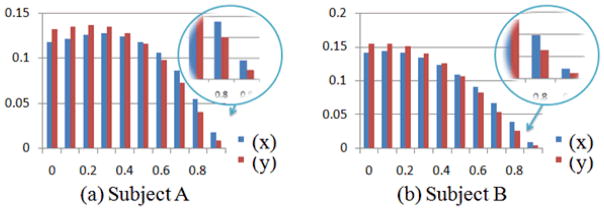
Histogram of Pearson’s correlation (correlation coefficient are binned at horizontal axis) of SCGM voxel pairs (blue bars) and randomly selected GM voxel pairs (red bars) of two subjects.
Official websites use .gov
A
.gov website belongs to an official
government organization in the United States.
Secure .gov websites use HTTPS
A lock (
) or https:// means you've safely
connected to the .gov website. Share sensitive
information only on official, secure websites.
Histogram of Pearson’s correlation (correlation coefficient are binned at horizontal axis) of SCGM voxel pairs (blue bars) and randomly selected GM voxel pairs (red bars) of two subjects.