
Figure 17.
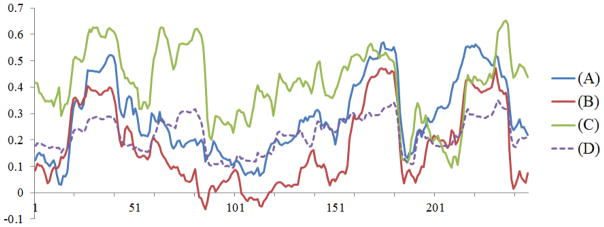
Functional connectivity dynamics on three sub-networks. The curves in the figure are the local CSC between structurally-connected brain regions. The blue curve (A) is the functional connectivity strength between “middle frontal gyrus right” and “middle frontal gyrus left”. The red curve (B) is the connectivity strength between the “middle frontal gyrus right” and the “superior frontal gyrus left”. The green curve (C) is the connectivity strength between the “middle frontal gyrus right” and the “thalamus left”. The dashed purple curve (D) is the global CSC for the purpose of comparison.