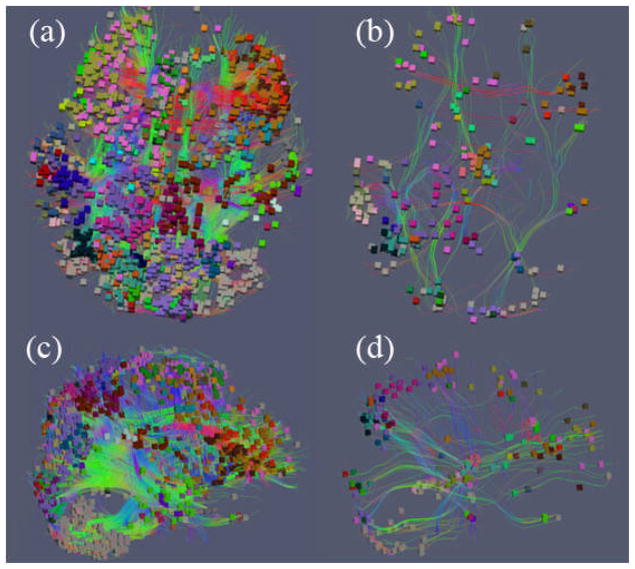
Figure 4.
Two connectivity states from two different time windows of one subject. Fiber-connected voxel (colored boxes) pairs with FC greater than the threshold of 0.8 are visualized. Voxels are colored by the MNI (Montreal Neurological Institute) atlas labels in (Shen and Davatzikos, 2002). (a) Connectivity state (highly functional correlated voxel pairs) during the time window from 78s to 96s that falls into the stimulus period of task-based fMRI (Faraco, et al., 2011); (b) Connectivity state during the time window of 34s to 52s which falls into the baseline period; (c) Lateral view of (a); (d) Lateral view of (b).

