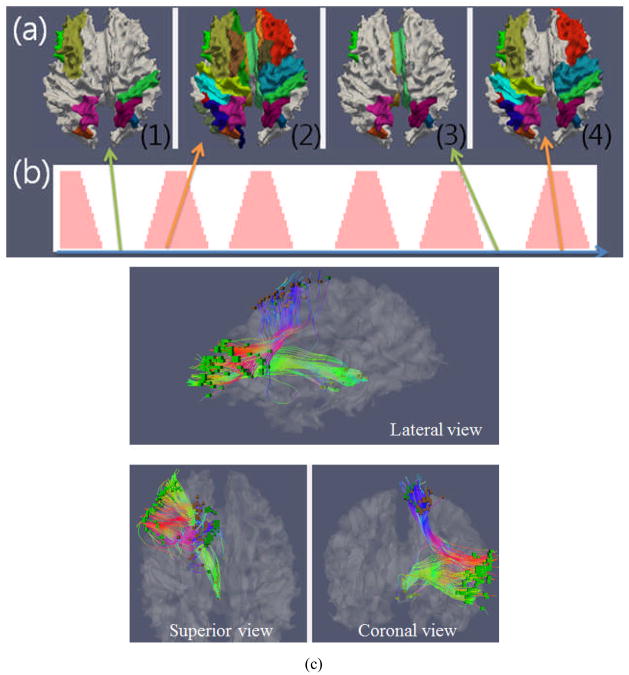
Figure 6.
Illustration of assessment of functional connectivity dynamics in sub-networks. (a) Regions with high functional connectivity are highlighted with colors on the cortical surface, during four separate brain states ((1)–(4)); (b) Integrated external stimulus curve during task-based fMRI. The brain state (1) and (3) in (a) correspond to the baseline intervals in (b), and the brain state (2) and (4) in (a) correspond to the stimulus intervals in (b). (c). Example of SCGM voxel pairs in sub-networks.

