
Figure 7.
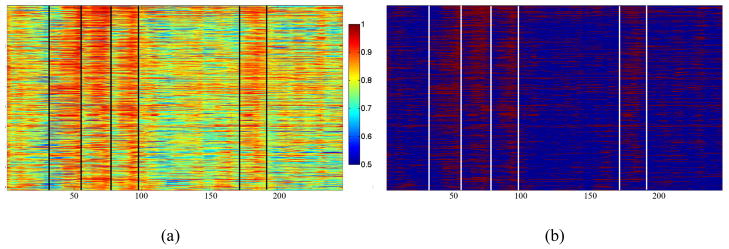
An example of FCV and CEV matrix visualization over the whole fMRI scan time course. (a) FCV matrix; the black lines show the state change boundaries; (b) CEV matrix. The white lines are fiber connections with correlation value greater than the threshold T1.