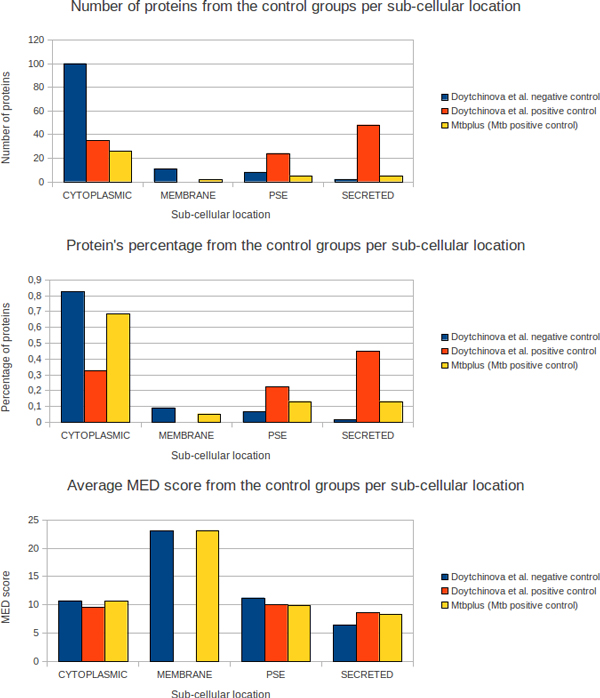
Figure 2.
MED score applied into previous control groups. Three previously published protein control groups were assessed according to predicted sub-cellular location and the average MED score. Quantities (top panel) and percentages (middle panel) of proteins, plus the average MED scores per predicted local sub-cellular, were analyzed. These control groups include M. tuberculosis antigenic proteins obtained from the AntigenDB site that were observed eliciting immune cellular responses and the control groups presented by Doytchinova et al. (2007).

