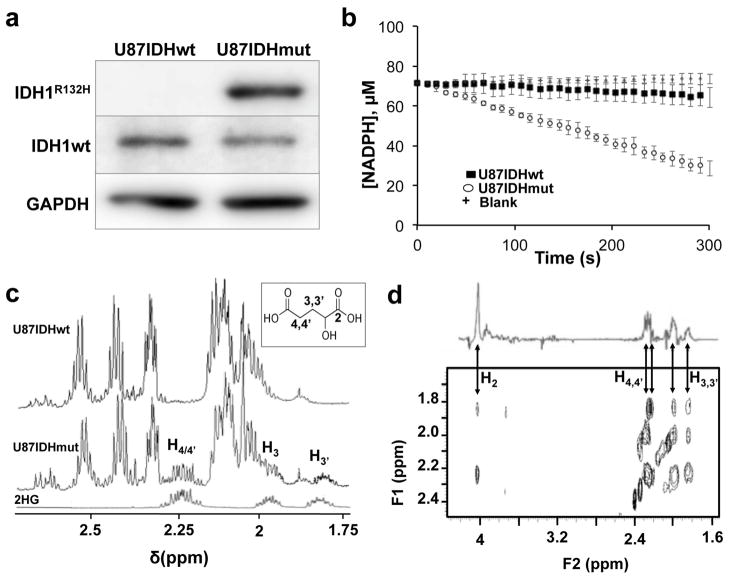
Figure 2. Mutant IDH1 cells exhibit elevated enzyme activity and 2-HG levels.
(a) Western blotting for wild-type IDH1 (IDH1wt, 46kDa) and mutant IDH1 (IDH1R132H, 46kDa) isoforms in U87IDHmut and U87IDHwt cells (GAPDH (40.2kDa) was used as a loading control; see Supplementary Figure S1 for full blots). (b) Spectrophotometric assay of mutant IDH1 activity in U87IDHwt (■) and U87IDHmut (
 ) cells, monitoring changes in NADPH absorption over time at 340 nm, compared to buffer blank (+). (c)
1H spectra of pure 2-HG (bottom), U87IDHwt cell lysate (top) and U87IDHmut cell lysate (middle). Insert shows the structure of 2-HG and annotated protons detected in the spectrum. (d) Zoomed view of 2D 1H TOCSY of a U87IDHmut cell lysate acquired at 14 Tesla, illustrating the cross peaks characteristic of 2-HG (H2=4.00ppm; H3,3′=1.85/2.00ppm; H4,4′=2.25ppm). A projection representing the sum of all slices containing the 2-HG spin system is shown on top of the TOCSY box.

