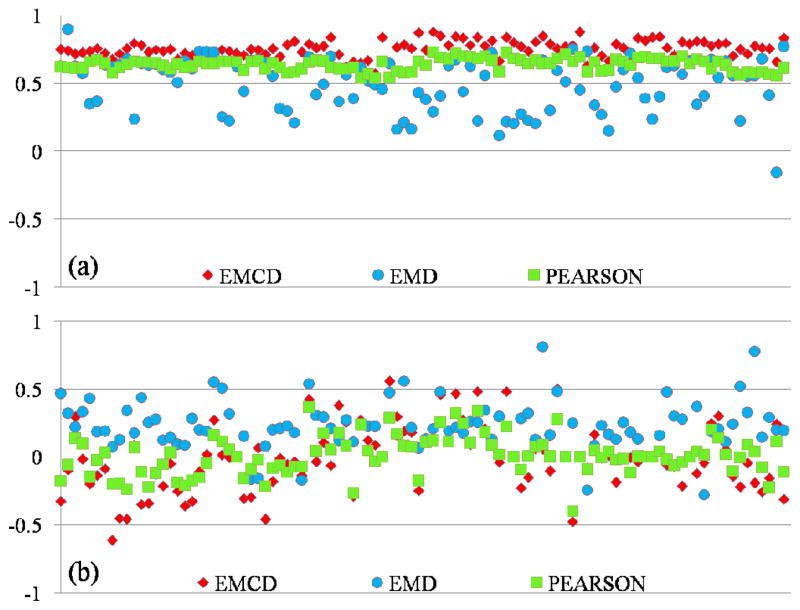
Fig 13.
Correlations between the FSL FEAT BOLD model and the EMCD components, the EMD components and raw fMRI signals (annotated by Pearson in the figure). The numbers on the left refer to the correlation values. (a) Results for 100 time series from randomly selected activated voxels in auditory task-based fMRI dataset; (b) Results for 100 time series from randomly selected non-activated voxels in the same dataset.

