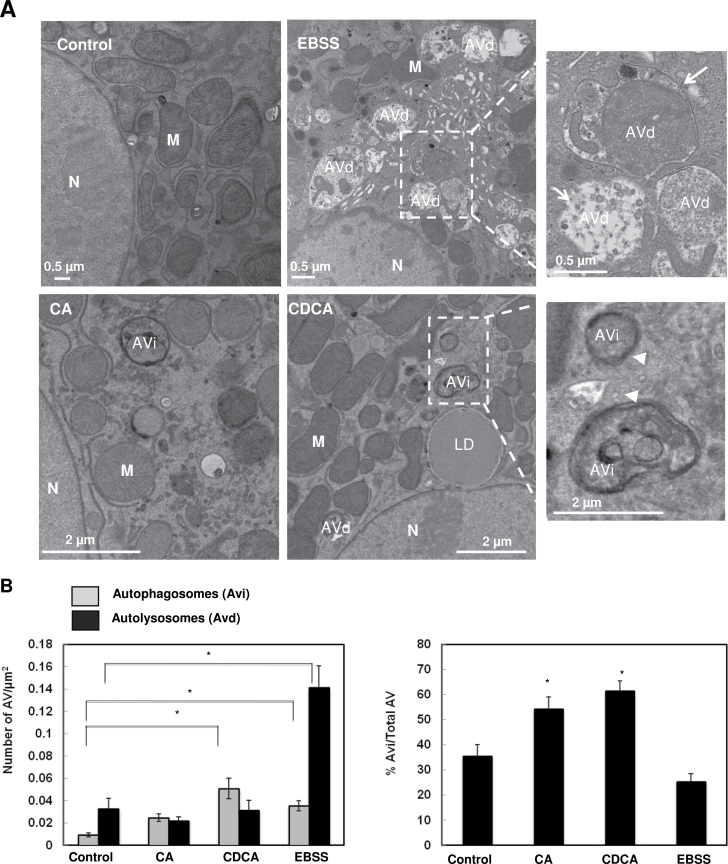
FIG. 6.
BAs induced accumulation of early autophagosomes. A, Hepatocytes were treated with 100 µM of CA or CDCA or EBSS for 6h. Representative EM images are shown. Right panels are enlarged images from the boxed areas. Arrow heads: early autophagosome (Avi) and arrows: autolysosome (Avd). M, mitochondria; N, nuclei. B, Early autophagosomes (AVi) and late autophagosomes (AVd) were quantified and AVi/AVd ratio is presented (>20 different cell sections).

