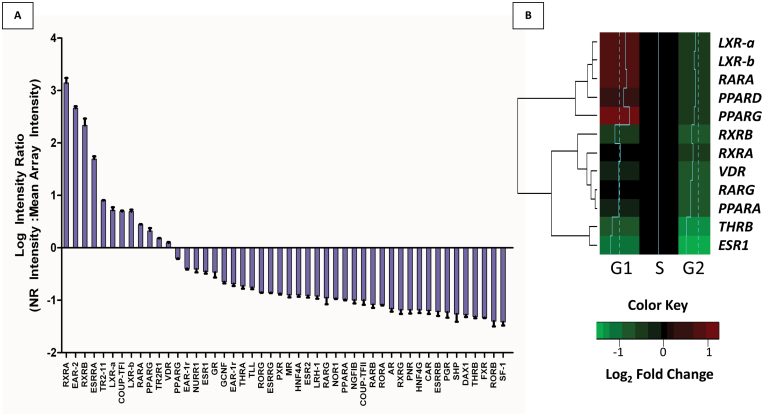
Fig. 1.
Expression of the NR network in non-malignant prostate epithelial cells (RWPE-1). (A) Basal expression of the 48-member human NR superfamily from microarray analysis of untreated RWPE-1 cells. Expression is represented as the log2 intensity ratio, with each individual NR normalized intensity set relative to the mean normalized intensity across arrays. (B) RWPE-1 basal expression of NRs across the phases of the cell cycle. Expression of NR was measured in FACS separated, basal RWPE-1 cells by Q-RT–PCRM and normalized to 18S expression in each phase of the cell cycle. Heatmap represents Log2 fold changes relative to S phase expression. Histograms (blue): dotted line represents 0 Log2 FC, and histograms represent relative change of given gene (right=up, left=down). Results were determined in triplicate experiments.

