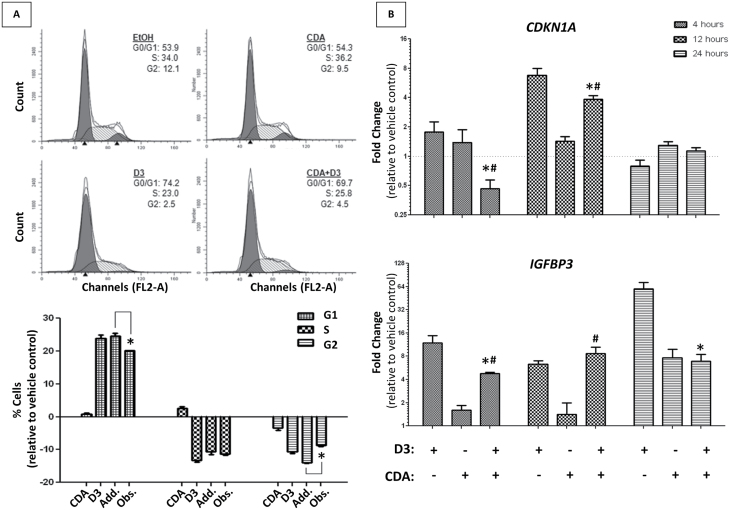
Fig. 3.
The effects of 1,25α(OH)2D3 and CDA on the cell-cycle status and gene regulation. (A) Cell-cycle analysis of RWPE-1 cells measured by FACS analysis. Cells were treated with ligand ED25 concentrations individually and in combination for 24h. Representative cell-cycle distributions are shown (upper panel), with subsequent quantification of three biological replicate populations (lower panel). Significant changes (determined by t-test) of cell population at any given cell cycle are noted, comparing additive results to those observed experimentally. (B) VDR candidate gene expression profile in RWPE-1 cells. Expression of known VDR-regulated genes (IGBFP3, CDKN1A) at different time points of treatment (4, 12, 24h) determined via Q-RT–PCR. The 1α,25(OH)2D3 (D3) and CDA were dosed individually and in combination at ED25 concentrations and were compared with respective vehicle controls. Significant changes of gene expression between combination treatment and individual treatments (*D3, #CDA) are noted.

