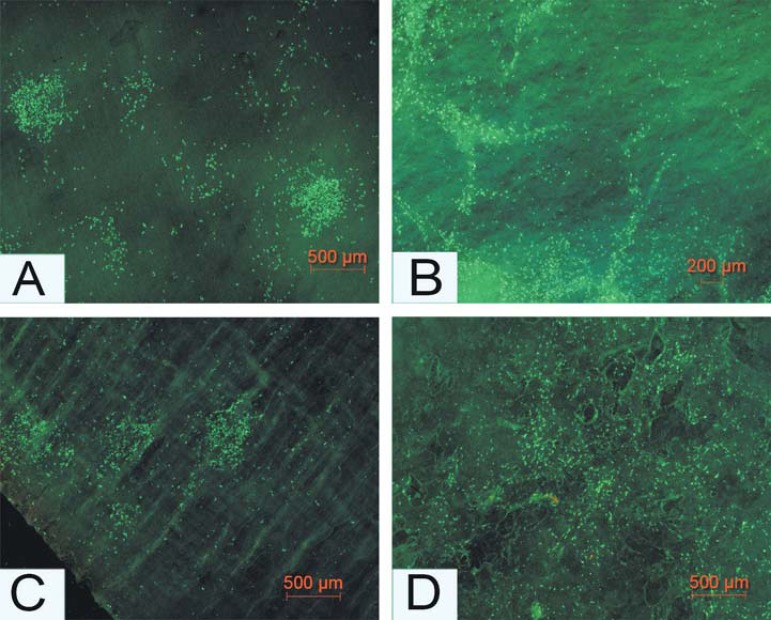
Figure 3.
Growth behavior of human gingival fibroblasts on both sides of the two materials. A (BG) and C (MG) show the fluorescent visualization of distribution/growth behavior of the gingival fibroblast on the compact layers of the materials, while B (BG) and D (MG) display the cellular behavior on the spongy layers of the materials. Magnifications: A and C x200; (scale bar=500 μm); B x100 (scale bar=200 μm); and D x200 (scale bar=500 μm). MG=Mucograft. BG=BioGide

