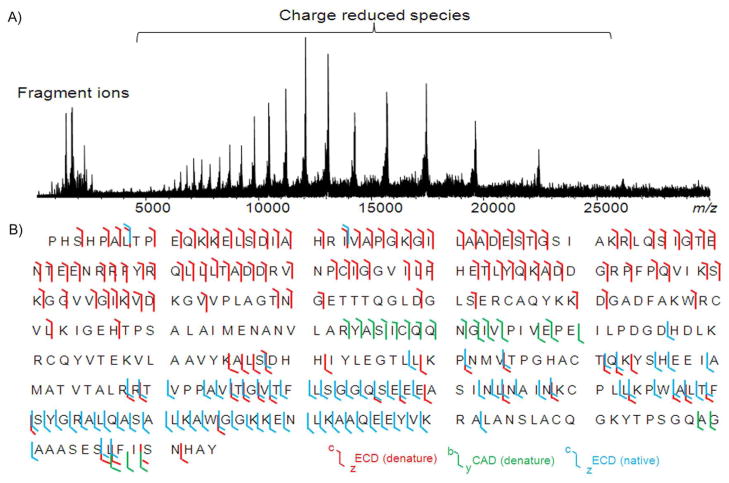
Figure 2.
A) Native top-down ECD mass spectrum of the aldolase tetramer and B) backbone cleavage coverage of aldolase by top-down MS/MS. c/z• ions from the top-down ECD of the 26+ charge state of denatured aldolase monomer are in red, b/y ions from the top-down CAD of the 26+ charge state of denatured aldolase are in green, and the c/z• ions from the native top-down ECD of aldolase tetramer (entire charge state envelope without isolation) are in cyan.

