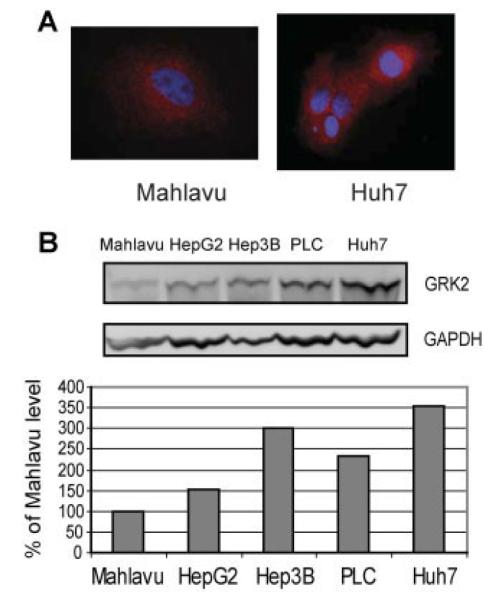
Fig. 1.

Basal GRK2 protein levels in HCC cell lines. A: Cytosolic distribution of GRK2. B: Basal GRK2 protein levels in all five HCC cell lines detected by Western blotting. Cell lysates (25 μg total protein) were subjected to immunoblotting with antibodies as indicated. GRK2 levels were normalized to GAPDH. The immunoblot shown is a representative of two independent experiments.
