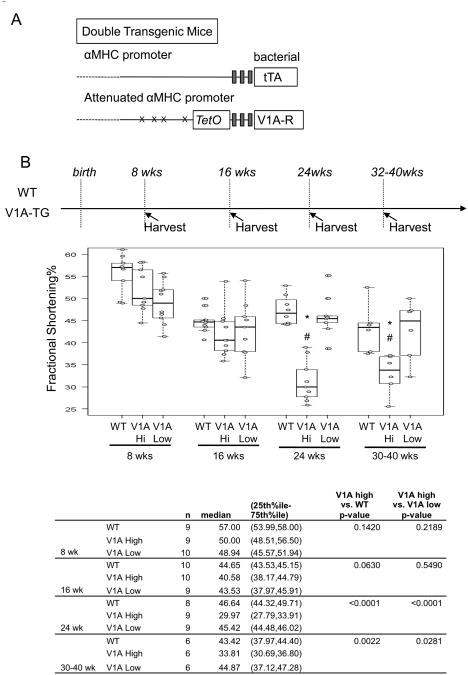
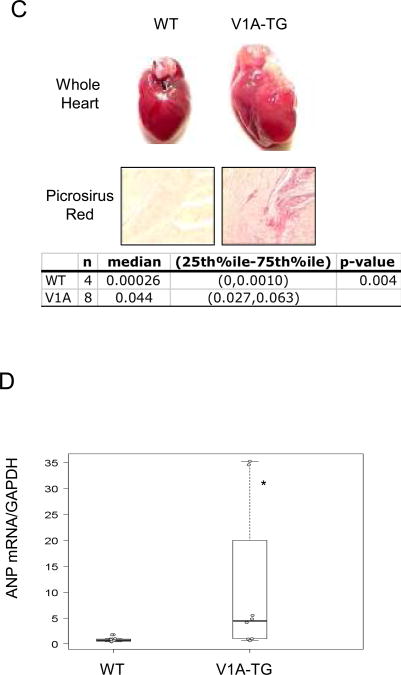
Figure 1.
(A) Schematic depiction of the two component transgenic system to induce cardiac V1A receptor expression. (B) Echocardiography was performed on high expression V1A-TG line (S13, V1A-high), low expression line (S10, V1A-low) and FVB-WT mice at indicated ages. Fractional shortening percentage was shown. Samples were analyzed by exact Wilcoxon test with results shown in the table. *adjusted p<0.001 vs WT, #adjusted P<0.05 vs V1A-low. (C) Whole heart images and Picrosirius Red staining of wild-type and V1A-TG mouse hearts at 24-week of age. 5um paraffin-embedded heart cross sections were stained with Picrosirius Red and digitally quantified. Representative of 200× magnified fields were shown. 5 images from two WT mice and 8 images from three V1A-TG mice were quantified. Samples were analyzed by exact Wilcoxon test and shown in the table. (D) ANP gene expression in the hearts of WT and V1A-TG mice. Total ventricular mRNA extracts from 24-week-old male mice were used for real-time PCR and signals were normalized to GAPDH expression in WT. *p<0.001 vs WT. Table of median, IQR and P values are included in the Supplemental Section.


