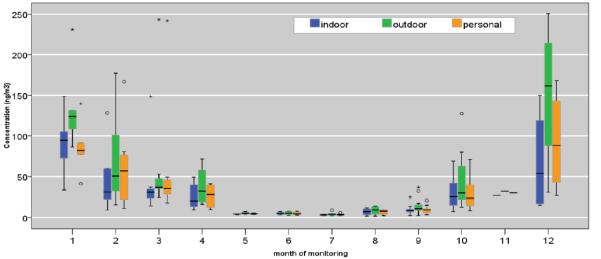
Figure 1.

Distribution of personal, indoor, and outdoor monitored levels of Σ8 c-PAHs (ng/m3). Boxes show 25th, 50th and 75th percentile; the whiskers show 5th and the 95th percentiles. The symbol (ο) represents measurements that are > 1.5- fold of the interquartile range.
