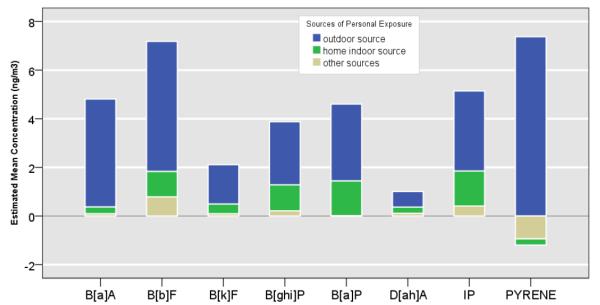
Figure 6.

Mean Personal Exposure concentrations of PAHs (ng/m3) shown according to outdoor (blue), home indoor (green) and other microenvironmental (tan) contributions.

Mean Personal Exposure concentrations of PAHs (ng/m3) shown according to outdoor (blue), home indoor (green) and other microenvironmental (tan) contributions.