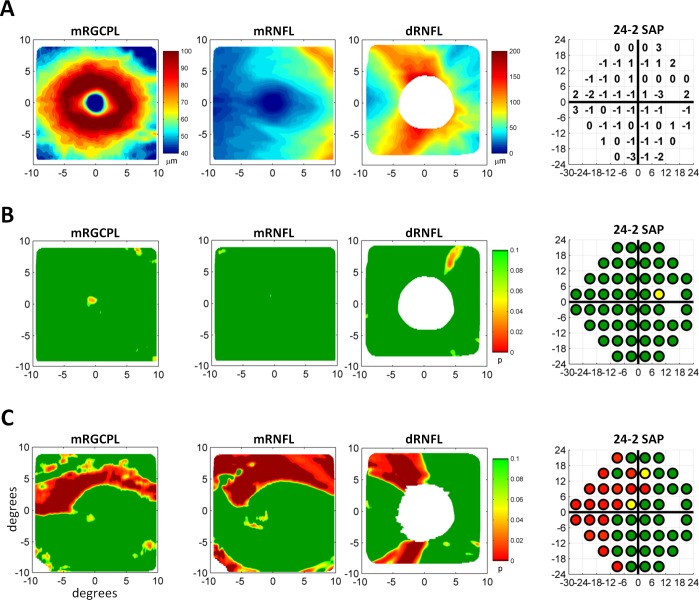
Figure 2.
Measurements from fdOCT and SAP converted to probability values. (A) The mRGCPL as well as the mRNFL and dRNFL thicknesses for a healthy control eye (left three panels). The 24-2 SAP total deviation values for the same eye (right). (B) The data in (A) converted to probability values. (C) Data from a glaucomatous eye in the same format as (B).

