Figure 3.
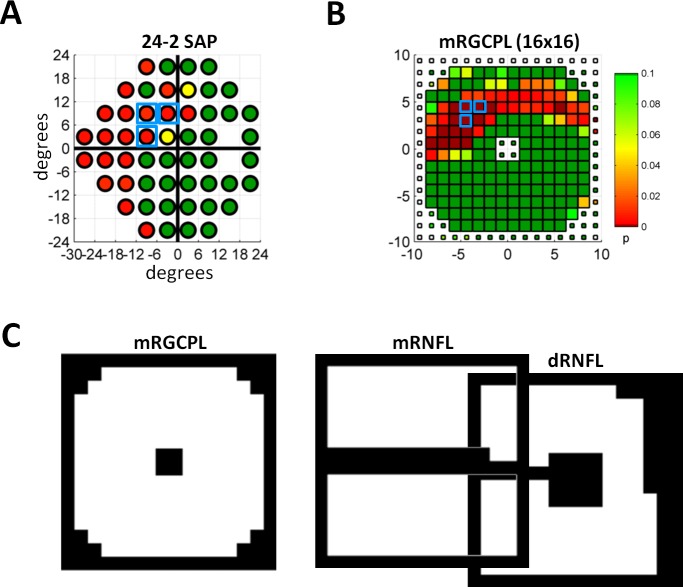
Cluster analysis and ROIs. (A) The 24-2 SAP data as in Figure 2C with a set of points meeting the 5-5-1 cluster criterion outlined by light blue boxes. (B) Probability values from mRGCPL thickness data downsampled into a 16 × 16 grid. Data are from the same eye shown in Figure 2C. The small squares indicate values outside the ROI. White squares indicate missing data (which often occurs at scan edges after centering the scan). A set of points meeting the 5-5-1 cluster criterion is outlined by light blue boxes. (C) The ROIs shown in white for the mRGCPL, mRNFL, and dRNFL data. The dRNFL is offset from the mRNFL data based on anatomy, as shown in Figure 1D.17,42

