
Figure 7.
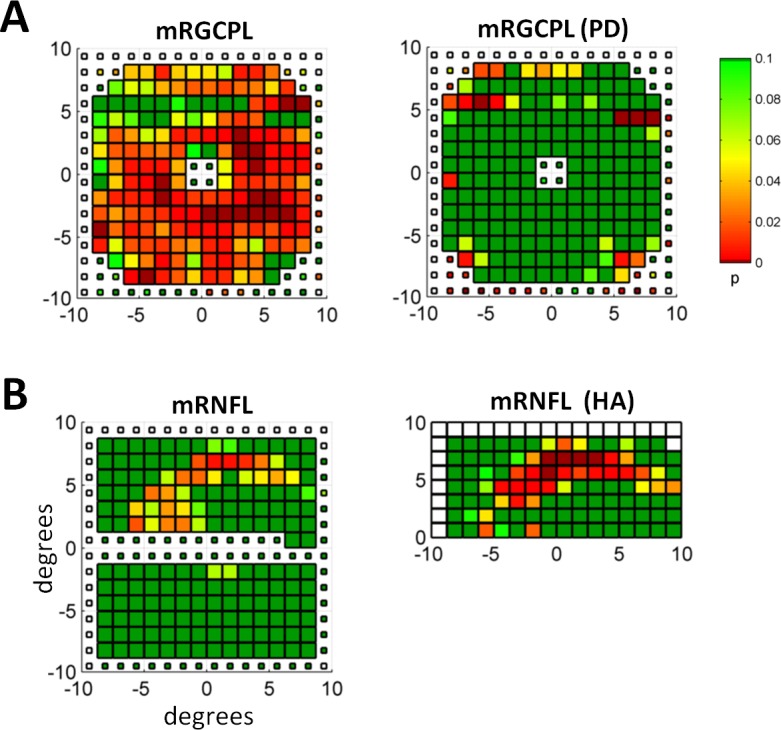
Examples of PD and HA analyses. (A) The mRGCPL probability values based on thickness (left) and the PD analysis (right) for an eye belonging to the healthy control group. (B) The mRNFL probability values based on thickness (left) and the HA analysis (right) for an eye belonging to the glaucomatous group. Same eye as shown in Figure 6.