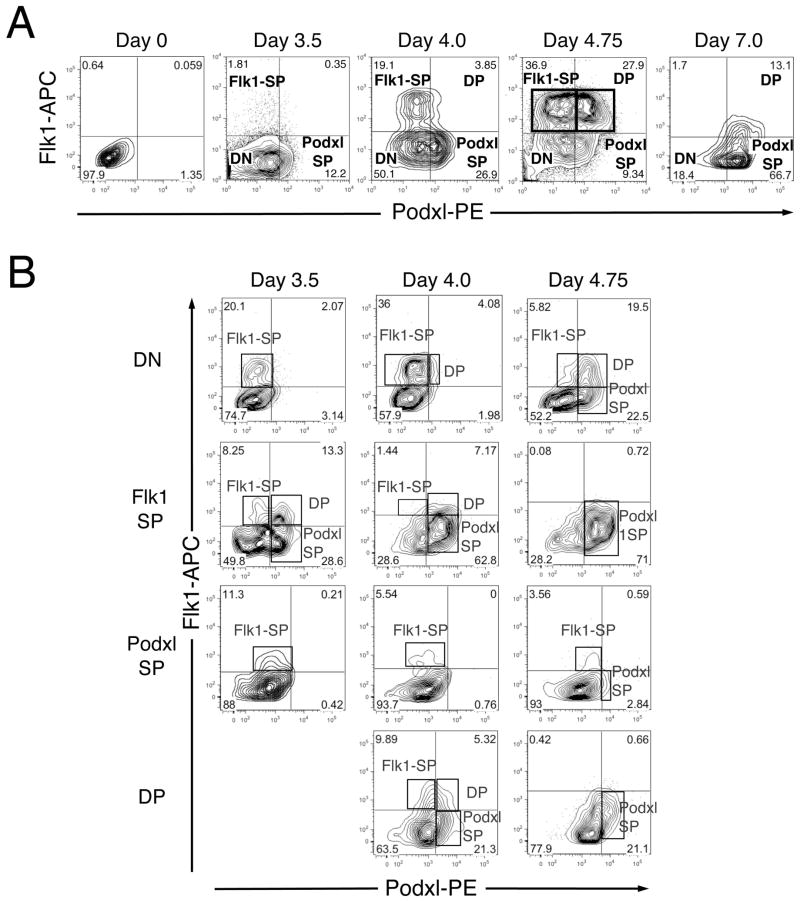
Figure 1. Expression of Podxl segregates populations of Flk1+ mesoderm during EB differentiation.
E14 ES cells were induced to differentiate as EBs and harvested at the days indicated. For sorting, EBs were dispersed to single cells and stained with anti-Flk1 and anti-Podxl antibodies. (A) Flow cytometric analysis showing subdivision of Flk1+ differentiating ES cells based on expression of Podxl. Boxes highlight the clear separation of Flk1-SP and DP populations at d4.75. (B) Representative flow cytometric analysis of sorted populations after re-aggregation and culture. Differentiating EBs were harvested at the indicated times, dissociated and subjected to antibody staining and FACS. Sorted populations (DN, Flk1-SP, Podxl1-SP and DP) were reaggregated and cultured for 20hr and then analyzed using flow cytometry. The new cell populations formed during re-culture are boxed. The d3.5 DP population was too small to analyze and is, therefore, not represented in this figure. This experiment was repeated three times, with comparable results.

