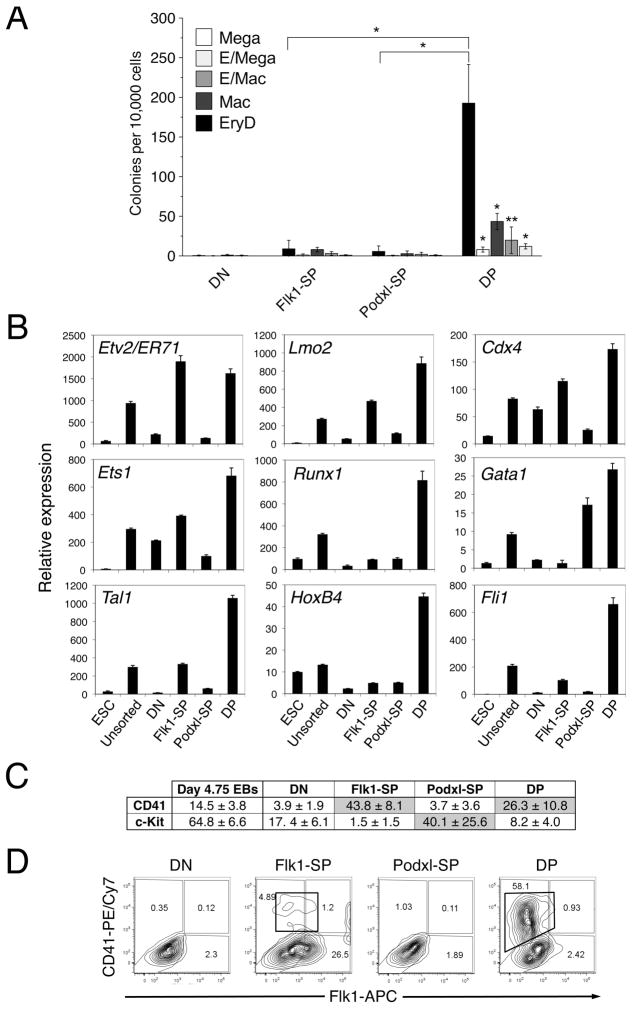
Figure 4. The DP population contains definitive hematopoietic potential.
(A) Multilineage progenitor assay to assess hematopoietic potentials of sorted d4.75 EB cell populations. Cells (10,000) were plated in methylcellulose supplied with cytokines. EryD colonies were scored on d5 and other colonies on d10. Data from 3 independent experiments were analyzed using an unpaired two-tailed Student’s t-test. The DP population generated significantly larger numbers of definitive hematopoietic colonies than did any of the other populations (* p < 0.0001; ** p < 0.05). EryD, definitive erythroid; Mega, megakaryocyte; Mac, macrophage; E/Mac, mixed erythroid/macrophage; and E/Mega, mixed erythroid/megakaryocyte colonies. (B) QRT-PCR analysis of the expression of genes encoding hematopoietic and endothelial transcription factors. Total RNA was isolated from the sorted d4.75 EB populations (DN, Flk1-SP, Podxl-SP and DP) and analyzed using QRT-PCR. The expression of each gene was normalized to that of Gapdh. This experiment was performed three times, with comparable results. ESC, undifferentiated ES cells; unsorted, unsorted d4.75 EBs. (C) The sorted d4.75 EB populations were analyzed by flow cytometry for expression of c-Kit and CD41. This experiment was repeated three times, with comparable results. (D) Representative flow cytometric analysis of Flk1 and CD41 on d4.75 EB populations after reculturing on collagen type IV for 3d. This experiment was performed 4 times, with comparable results. The CD41+ cells formed from the DP and Flk1-SP populations are boxed.

