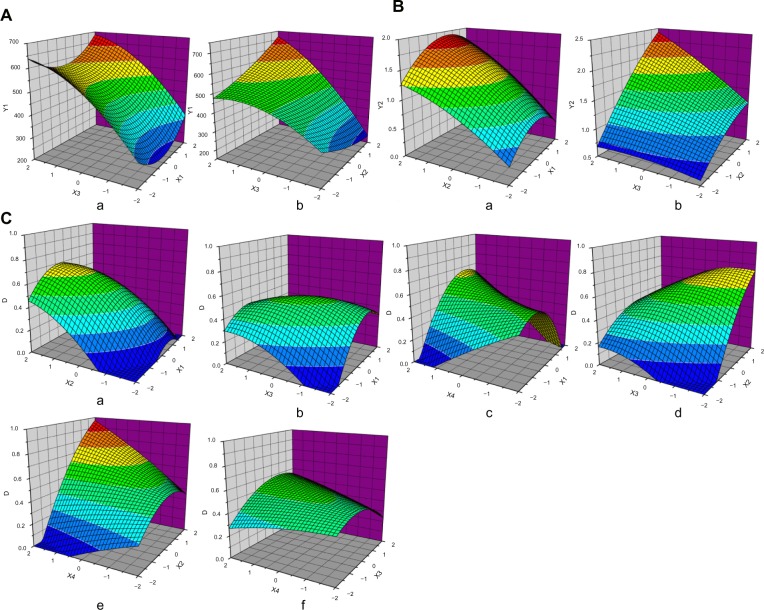
Figure 2.
Response surface plots of CCD.
Notes: (A) Response surface plots of mean particle size (Y1), X1= CTS/TPP; X2= 5-FU/CTS; TPP concentrations (%, w/v). (B) Response surface plots of drug content (Y2), X1= CTS/TPP; X2= 5-Fu/CTS; TPP concentrations (%, w/v). (C) Response surface plots of total desirability function, X1= CTS/TPP; X2= 5-FU/CTS; TPP concentrations (%, w/v); X4= crosslinking time (minutes).
Abbreviations: 5-FU, 5-fluorouracil; CCD, central composite design; CTS, chitosan; TPP, tripolyphosphate sodium; w/v, weight per volume.

