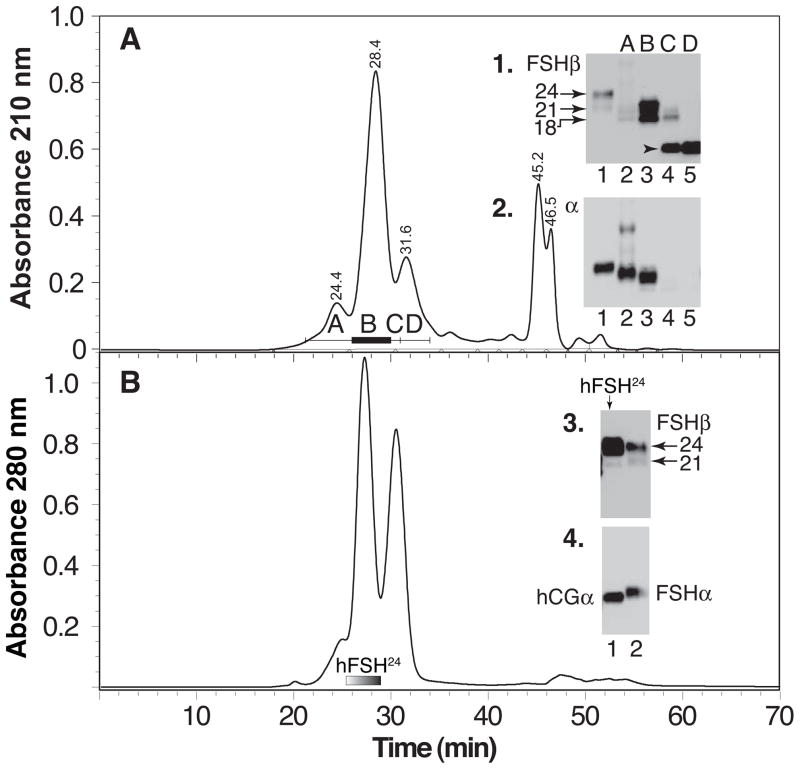
Figure 2. Hypo- and fully-glycosylated hFSH isolation.
A. Immunopurified hFSH fractionated by Superdex 75 chromatography and fractions analyzed by Western blotting. Fractions indicated by bars and numbers. Insets 1 & 2. Western blot analysis of 1 μg samples of reduced Superdex 75 fractions with FSHβ- and FSHα-specific antibodies RFSH20 and HT13, respectively. Lane 1, hFSH AFP7298A; lane 2, fraction A; lane 3, fraction B; lane 4, fraction C; lane 5, fraction D. The arrows show the positions of the hFSHβ21,000 and 24,000 Mr bands, as indicated. B. The 24,000 Mr hFSHβ was combined with hCGα and incubated for 72 hr at 37°C. The mixture was reduced to <200 μl and applied to a Superdex 75 column as described under Methods. Insets 3 and 4, FSHβ and FSHα Western blot analysis of reduced Superdex 75 fractions, respectively. Lane 1, hFSH24; lane 2, pituitary hFSH (AFP7298A).

