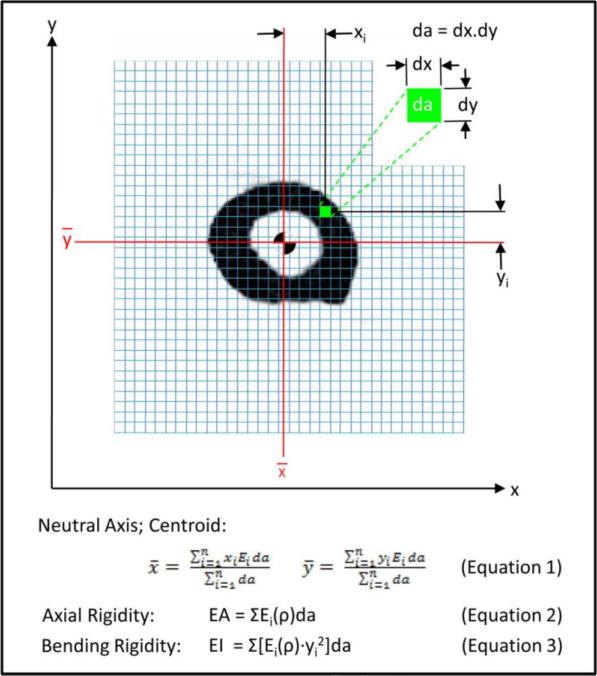
Figure 2.
Schematic diagram illustrating the pixel-based CTRA analysis algorithm to calculate axial (EA) and bending (EI) rigidities. Each grid element is intended to represent one pixel (the exaggeration of the grid element size is done solely for illustration purposes). The different equations are presented, where ρ represents bone density, xi and yi represent the distance of each pixel form the x and y axes respectively, da represents the area of each pixel, Ei represents Young's modulus of elasticity (defined as the ratio of tensile strength to strain in the linear region), and Gi represents the shear modulus (defined as the ratio of shear stress to shear strain in the linear region).
The modulus neutral axis and centroid (Equation 1) are determined based on the coordinates of the ith pixel, its modulus (Ei), area (da), and total number of pixels in the bone cross-section (n). Axial rigidity, which provides a measure of the bone's resistance to deformation when subjected to uniaxial tensile or compressive loads (equation 2), is estimated by summing the products of each pixel's elastic modulus (Ei) and pixel area (da). Bending rigidity provides a measure of the bone's resistance to flexure deformation when subjected to bending moments. Its rigidity about the y-axis (equation 3) is the sum of the products of the elastic modulus (Ei), square of the ith pixel distance to the neutral axis (ȳ), and the pixel area (da).

