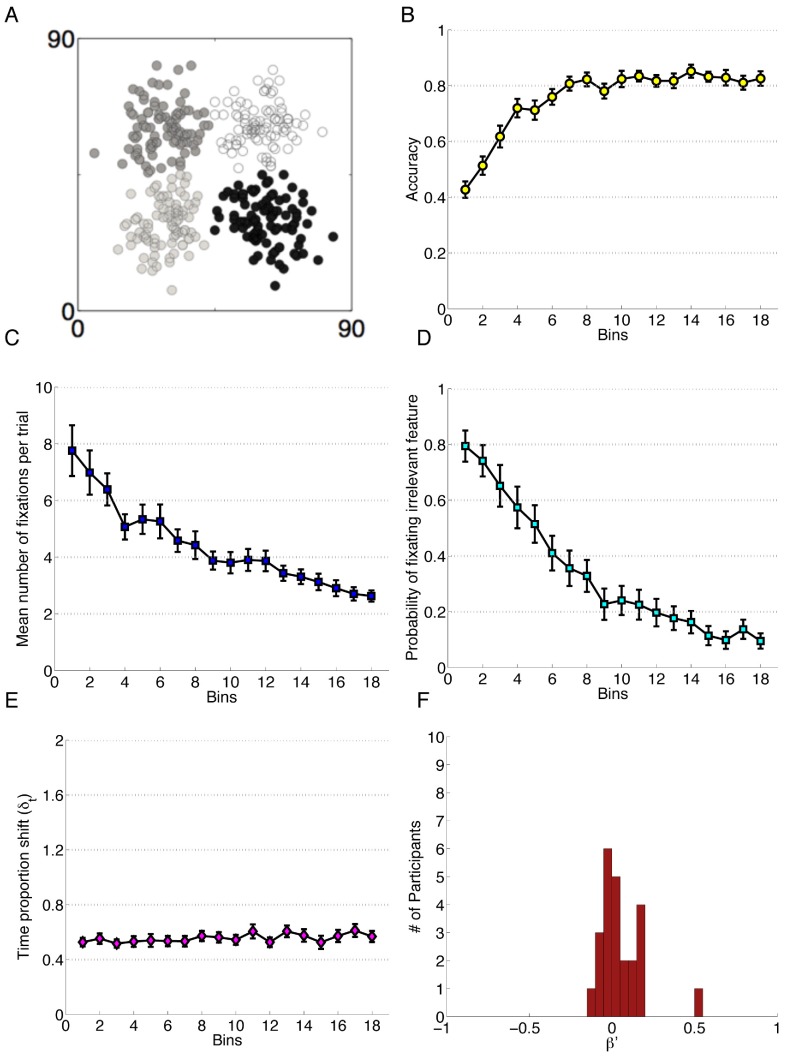
Figure 3. Data for Experiment 3.
Each bin reflects the average of 20 trials and error bars represent standard error of the mean. A) The category structure. B) Performance accuracy. C) Mean number of fixations per trial. D) Probability of fixating the irrelevant feature. E) Time proportion shift, δt. F) Error Bias, β′.

