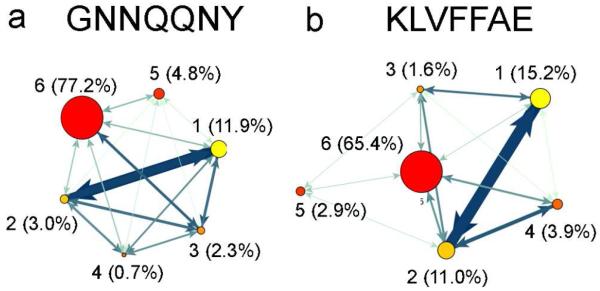
Figure 1.
Coarse grained transition networks for GNN (a) and KLV (b). The oligomeric states are shown as nodes connected by edges that represent the total number of transitions between two oligomeric states. The area of each node corresponds to the population while the color corresponds to the oligomeric state. The color and thickness of the edges changes from light green to dark blue and thin to thick, respectively, and corresponds to changes from fewest to most transitions between oligomeric states.

