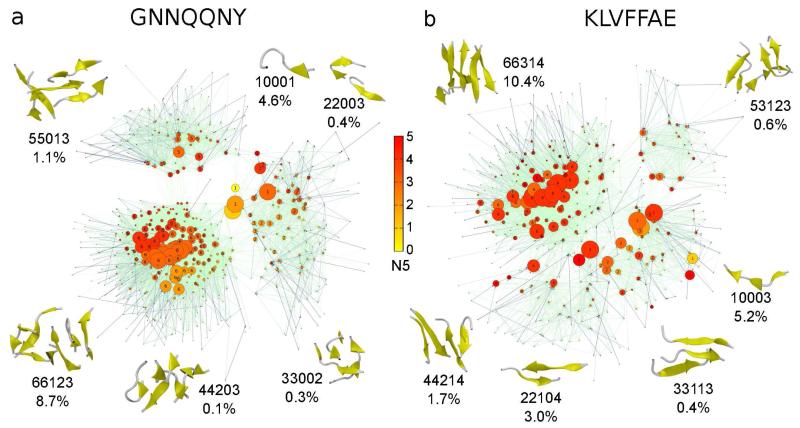
Figure 2.
Kinetic transition networks for GNN (a) and KLV (b). For both peptides the aggregation states N1N2N3N4N5 are shown as nodes connected by edges that represent transition probabilities. The size of each node corresponds to the population and the color corresponds to the average number of β-strand amino acids, N5. The color of the edges reflects the value of the transition probability, from light green for small probabilities to dark blue for high probabilities. For each oligomer size, N1, we illustrate representative conformations corresponding to the aggregation state with the highest population, together with the population of that state in percentage.

