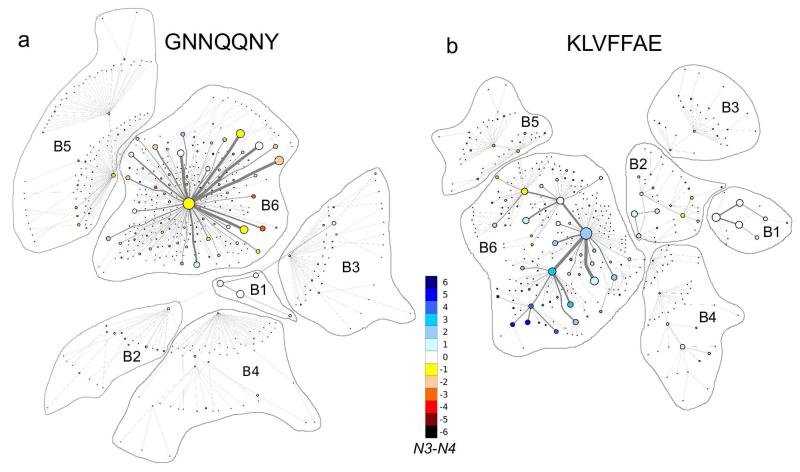
Figure 3.
Mincut transition networks for GNN (a) and KLV (b). The coloring of the nodes reflects N3 – N4, which indicates the excess number of antiparallel peptide pairs relative to parallel peptide pairs. Edges shown in gray represent the number of transitions returned by the mincut algorithm. Clusters of states with identical values of N1 have been outlined and identified as basin Bi, where i takes the value of N1.

