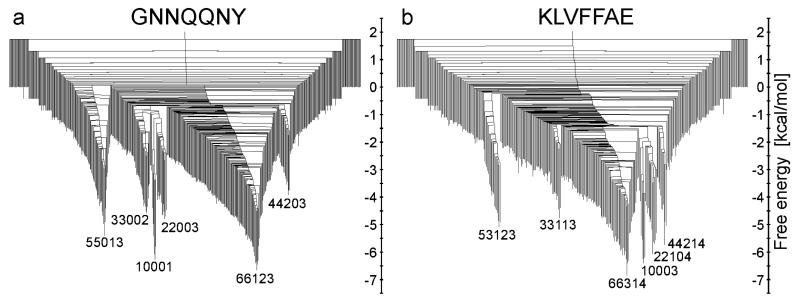
Figure 4.
Mincut disconnectivity graphs for GNN (a) and KLV (b). The vertical axis is Fi ~ −kT ln Zi and Fij ~ −kT ln Zij for minima and barriers, respectively. Representative aggregation states for the lowest free energy minima are labelled and corresponding structures are shown in Fig. 2.

